
Read your project overview
Production status, errors, checks and cost at a glance, with metrics and recent deployments below.
The Project tab answers “is everything OK?” for the project you have selected.
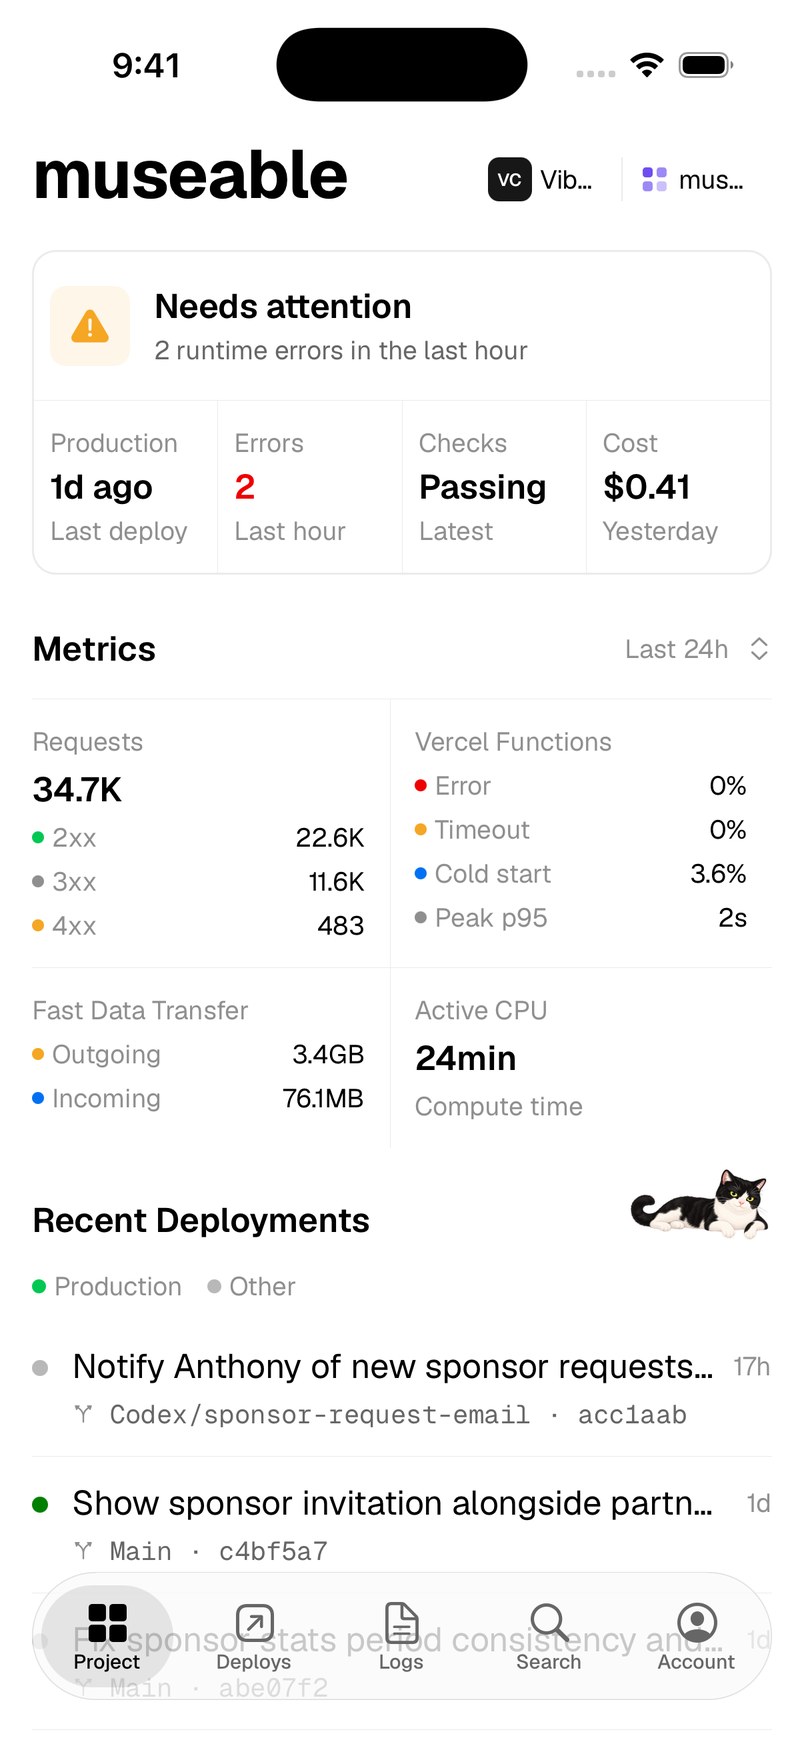
The health card
The headline sums up production: All systems normal, Needs attention, Deploying to production or Production build failed. Below it are four numbers, and each one opens the screen behind it:
- Production: time since the last production deploy.
- Errors: errors in the last hour. Tap to open logs filtered to errors.
- Checks: whether the latest production checks passed.
- Cost: what the project cost yesterday. Tap for Usage.
Metrics
Requests by status code, Vercel Functions (errors, timeouts, cold starts and peak p95), Fast Data Transfer, Active CPU, and visitors and page views. Tap the range in the corner to switch between the last 15 minutes and the last 7 days.
Recent deployments
The latest five deployments, with branch and commit. Below them, Cron Jobs appears if the project has any, and Project Tools links to Environment Variables, Storage, Feature Flags, Observability Alerts and more.
Team Overview
Choose All Projects in the switcher and the tab becomes the Team Overview: recent previews, your favourite projects, every project in the team, and shortcuts to Alert Rules, Usage and Team Management.
Need more help?
Ask on the feedback board or email support@vercat.dev.
Last updated
